Overlay Charts vs. Simulation Decomposition
SimDec outperforms traditional overlay charts in visualizing uncertainty in environmental decision models — offering clearer insights into how multiple variables interact.
Seeing Through Uncertainty
Forward-looking decision-making rarely comes with certainty. Models that guide policies or investments—like those in renewable energy or carbon management—depend on variables that fluctuate, interact, and remain partly unknown. To make sense of this, analysts turn to Monte Carlo simulations, which model thousands of possible futures and summarize them as probability distributions.
But while simulation is powerful, its value depends on how the results are visualized.
The Problem with Overlay Charts
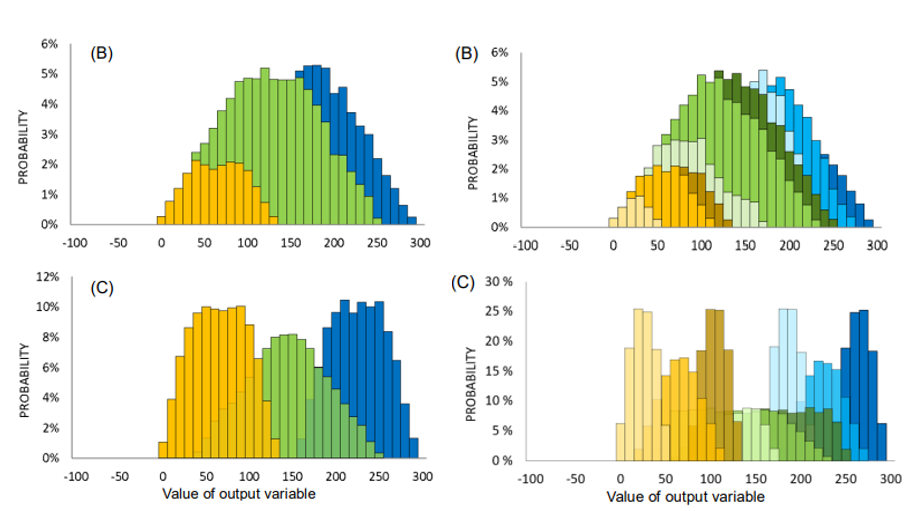
For decades, the standard tool in commercial Monte Carlo packages has been the overlay chart. It stacks multiple simulation outputs in one graph to compare uncertainties side by side. Useful, yes—but often misleading.
Because each overlayed scenario is simulated independently, the chart ignores how likely each scenario actually is. When scenarios differ in probability or range, their visual weight no longer reflects their real-world significance. Add more scenarios, and clarity vanishes behind overlapping colors and hidden distributions.
The Rise of Simulation Decomposition (SimDec)
Enter Simulation Decomposition (SimDec) — a visual analytics method developed to overcome these exact limits.
SimDec runs one unified simulation, then decomposes the results into color-coded sub-distributions that correspond to different combinations of input states. This means every part of the output distribution remains true to its probability, yet also traceable to its causes.
As shown in Figure 2 of the paper, SimDec visually preserves both the shape and the likelihoods of scenarios — something overlay charts cannot do without excessive re-simulation and manual adjustment.
Why It Matters for Decision-Making
Environmental models often include many uncertain, interacting variables — weather patterns, policy changes, technology costs, human behavior. SimDec helps decision-makers see how combinations of these factors influence outcomes, not just which single variable is “important.”
In practice, this clarity has already benefited applications like:
- Renewable energy policy (Hietanen, 2020)
- Carbon footprint and sustainability analysis (Deviatkin et al., 2020)
- Green construction and investment planning (Sadyhova, 2020)
By preserving both the overall uncertainty and its decomposition, SimDec supports richer, more intuitive reasoning in fields where uncertainty is the rule rather than the exception.
The Verdict
Overlay charts helped visualize risk in the past. But as models grow in complexity, SimDec proves more adaptable, transparent, and informative. It visualizes uncertainty not as a blur of overlapping shapes—but as a meaningful pattern of interactions.
Or, as Kozlova and Yeomans conclude:
“SimDec’s straightforward visualizations of complex stochastic uncertainties render the technique so inherently practical and adaptable for Monte Carlo-based environmental decision-making.”
Based on “Visual Analytics in Environmental Decision-Making: A Comparison of Overlay Charts versus Simulation Decomposition” by Mariia Kozlova and Julian S. Yeomans (Journal of Environmental Informatics Letters, 2020).